Cellular and molecular Neuroimaging Maps Released April, 2025, Updated Sept. 2025.
Cellular and molecular maps encompassing the 24 cell types inferred in study below are downloadable as NIfTI files by clicking here.
Reference:
Neuromark Templates for different age phases and modalities derived from large datasets, released in March, 2024, having more information about the templates in word document found by clicking here and are supplied with five different templates in this section found below:
- An infant Independent Component Network (ICN) template, having a model order of 100 components. The network template is downloaded by clicking following link, Neuromark_fMRI_3.0_infant_modelorder-100.nii, including a label file at Neuromark_fMRI_3.0_infant_modelorder-100.txt.
- A developmental Independent Component Network (ICN) template, having a model order of 100 components is downloaded by clicking following link, Neuromark_fMRI_3.0_development_modelorder-100.nii, including the label file Neuromark_fMRI_3.0_development_modelorder-100.txt.
- An Independent Component Network (ICN) template for aging population, having a model order of 100 components is downloadable at following link, Neuromark_fMRI_3.0_aging_modelorder-100.nii, including the label file Neuromark_fMRI_3.0_aging_modelorder-100.txt.
- A diffusion fractional anisotropy (FA) Independent Component Network (ICN) template, having a model order of 100 components is downloaded by clicking following link, Neuromark_dMRI_3.0_modelorder-100_3x3x3.nii, including the label file Neuromark_dMRI_3.0_modelorder-100_3x3x3.txt.
- A structural T1-based Independent Component Network (ICN) template, having a model order of 100 components is downloaded by clicking following link, Neuromark_sMRI_3.0_modelorder-100_3x3x3.nii, including the label file Neuromark_sMRI_3.0_modelorder-100_3x3x3.txt.
Reference:
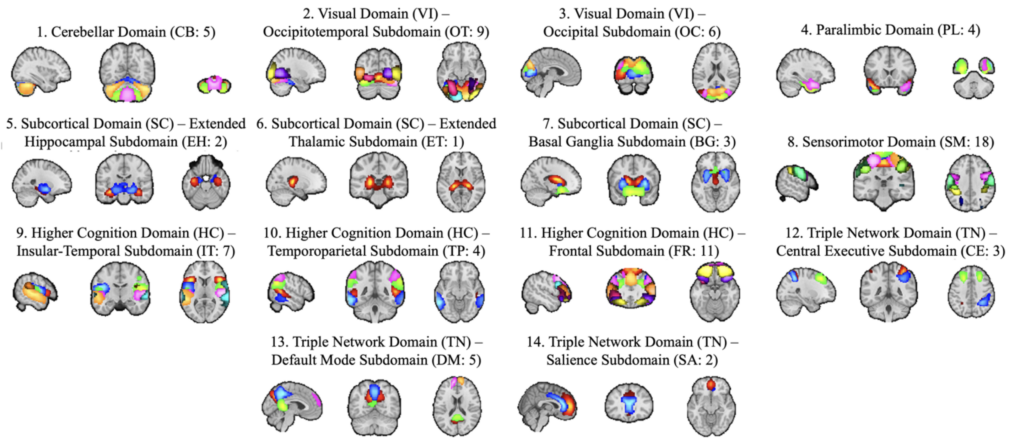
Multi-scale fMRI Neuromark Templates for both White & Gray Matter, derived from very large data (N~100K) released Feb, 2026:
A White and Gray Matter (WMGM) multi-scale order Independent Component Network (ICN) template, is a composite derived from created from the Neuromark_fMRI_WM_2.2_modelorder-multi (97 networks) and the Neuromark_fMRI_2.2_modelorder-multi (105 networks) can be downloaded by clicking following link, Neuromark_fMRI_WMGM_2.2_modelorder-multi.nii.gz, including the label file Neuromark_fMRI_WMGM_2.2_modelorder-multi.txt. The networks are non-artifactual and overlapping. Each of the two separate templates, including literature about them are found in sections below.
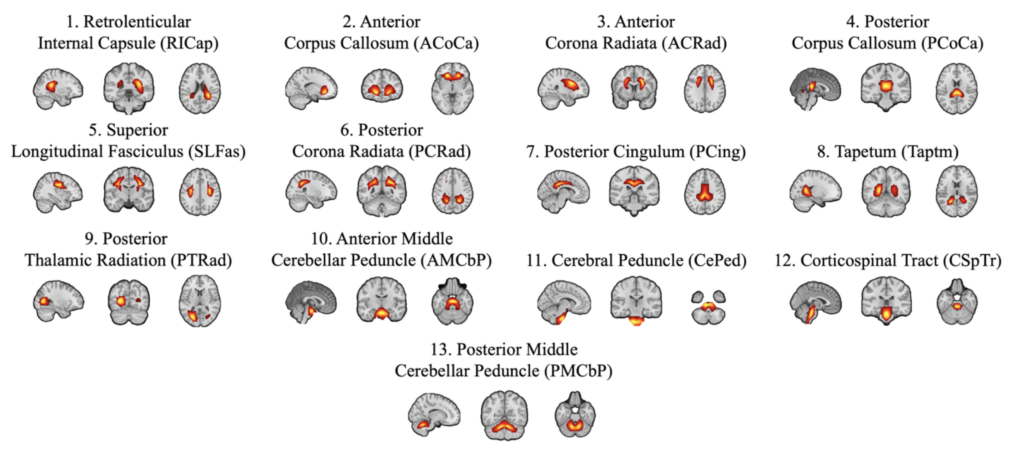
Multi-scale fMRI Neuromark Templates for White Matter, derived from very large data (N~100K) released December, 2024:
A White Matter (WM) multi-scale order Independent Component Network (ICN) template, created from 25, 50, 75, 100, 125, 150, 175, 200 components, yielding 97 non-artifactual and overlapping networks and can be downloaded by clicking following link, Neuromark_fMRI_WM_2.2_modelorder-multi.nii, including the label file Neuromark_fMRI_WM_2.2_modelorder-multi.txt.
Reference:
- V. Itkyal, A. Iraji, K.M. Jensen et al. “Evidence for white matter intrinsic connectivity networks at rest and during a task: a large-scale study and templates”. Manuscript submitted for publication.
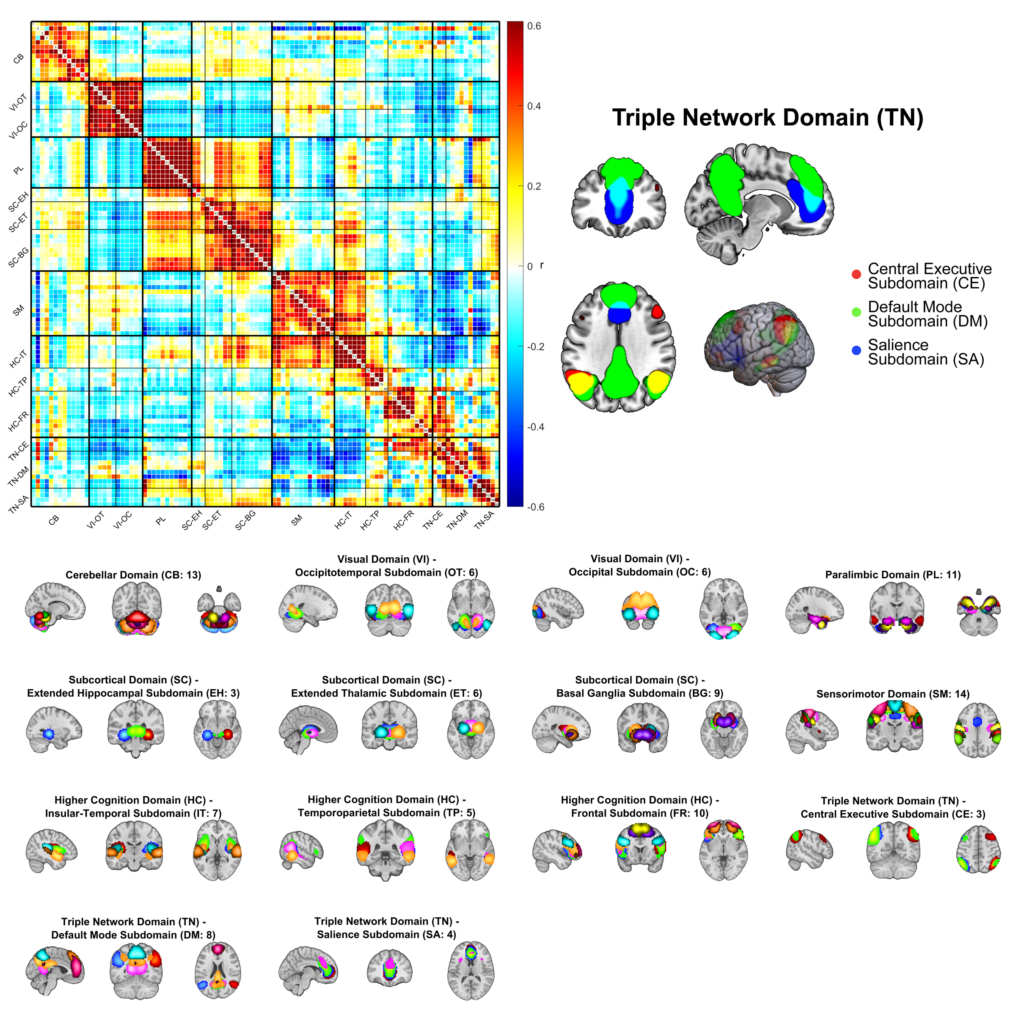
Optimized Multi-scale fMRI Neuromark 2.2 Template derived from very large data (N~100K) released September, 2024:
A resorted multi-scale order Independent Component Network (ICN) template, created from 25, 50, 75, 100, 125, 150, 175, 200 components, yielding 105 non-artifactual and overlapping networks and can be downloaded by clicking following link, Neuromark_fMRI_2.2_modelorder-multi.nii, including the label file Neuromark_fMRI_2.2_modelorder-multi.txt.
Reference:
- K. Jensen, J. A. Turner, V. D. Calhoun, A. Iraji. “Addressing inconsistency in functional neuroimaging: A replicable data-driven multi-scale functional atlas for canonical brain networks”, bioRxiv, 2024
- A. Iraji, Z. Fu, A. Faghiri, M. Duda, J. Chen, S. Rachakonda, T. DeRamus, P. Kochunov et. al. “Identifying canonical and replicable multi-scale intrinsic connectivity networks in 100k+ resting-state fMRI datasets”, Human brain mapping, 2023, https://doi.org/10.1002/hbm.26472
NeuroMark-SZ Effect Sizes:
Schizophrenia-control group difference effect sizes from a large resting-state fMRI analysis of 2,656 individuals (1,248 with schizophrenia) are available for download here (NeuroMark_SZ_effect_size_matrix.csv). The matrix corresponds with the NeuroMark 2.2 ordering and FNC features displaying significant group differences (FDR q < .05) are indicated with ‘1’ in the binary matrix here (NeuroMark_SZ_FDR_sig_matrix.csv).
Reference:
Optimized Multi-scale fMRI Neuromark Templates derived from very large data (N~100K) was released in March, 2023 and is here supplied with three different model orders:
- A low order Independent Component Network (ICN) template, created from 25 components, yielding 11 non-artifactual networks. The network template is downloaded by clicking following link, Neuromark_fMRI_2.0_modelorder-25.nii, including a label file at Neuromark_fMRI_2.0_modelorder-25.txt.
- A high order Independent Component Network (ICN) template, created from 175 components, yielding 58 non-artifactual networks. The network template is downloaded by clicking following link, Neuromark_fMRI_2.0_modelorder-175.nii, including the label file Neuromark_fMRI_2.0_modelorder-175.txt.
- A multi-scale order Independent Component Network (ICN) template, created from 25, 50, 75, 100, 125, 150, 175, 200 components, yielding 105 non-artifactual and overlapping networks and can be downloaded by clicking following link, Neuromark_fMRI_2.1_modelorder-multi.nii, including the label file Neuromark_fMRI_2.1_modelorder-multi.txt.
Reference:
Neuromark_fMRI_1.0 network template and respective network labels
Reference:
The Neuromark PET WM-GM template, released March, 2026, is provided for the florbetapir radioligand:
A White and Gray Matter (WMGM) florbetapir PET Independent Component Network (ICN) template with a model order of 100 can be downloaded using the following files:
* Neuromark_PET-FBP_WMGM_2.0_modelorder-100_3x3x3.nii.gz (network template)
* Neuromark_PET-FBP_WMGM_2.0_modelorder-100_3x3x3.txt (network labels)
All included components are non-artifactual. The figure below depicts the white matter components.
The figure below depicts the gray matter components.
Reference:
Neuromark SPECT Template, released April, 2026, supplied for the Technetium 99m Tracer:
Neuromark_SPECT-TC99_1.0.nii.gz network template and domain networklabels.
Reference:
Neuromark PET Template, released July, 2025, is here supplied for the florbetapir radioligand:
Neuromark_PET-FBP_1.0_modelorder-40_2x2x2.nii network template and respective network labels.
Reference:
Filtered Sliding Window Correlation. Please see Victor M. Vergara, PhD and Vince D Calhoun, PhD, “Filtered Correlation and Allowed Frequency Spectra in Dynamic Functional Connectivity”, Journal of Neuroscience Methods, July 2020.
Large ICA networks used in paper A. Iraji et al., “The spatial chronnectome reveals a dynamic interplay between functional segregation and integration”, HBM, 2019.
Autism Aggregate ICA map and labels used in paper:
Z. Fu, Y. Tu, X. Di, Y. Du, J. Sui, B. B. Biswal, Z. Zhang, N. de Lacy, V. D. Calhoun, “Transient increased thalamic-sensory connectivity and decreased whole-brain dynamism in autism”, Neuroimage 190, 2019, 191-204
Resting State Aggregate ICA maps used in papers:
- B. Rashid, E. Damaraju, G. D. Pearlson and V. D. Calhoun, “Dynamic connectivity states estimated from resting fMRI Identify differences among Schizophrenia, bipolar disorder, and healthy control subjects”, Front Hum Neurosci. 2014; 8: 897.
- B. Rashid, M. Arabshirani, E. Damaraju, M. Cetin, R. Miller, G. D. Pearlson and V. D. Calhoun, “Classification of schizophrenia and bipolar patients using static and dynamic resting-state fMRI brain connectivity”, NeuroImage, Volume 134, 1 July 2016, Pages 645-657.
Data visualization in the neurosciences: overcoming the curse of dimensionality. Click here for more information
- E. A. Allen, E. B. Erhardt, V. D. Calhoun. “Data visualization in the neurosciences: overcoming the curse of dimensionality”, Neuron, 74(4), 603-608, 2012.
Resting state data from E. Allen, E. Damaraju, S. M. Plis, E. Erhardt, T. Eichele, and V. D.Calhoun, “Tracking whole-brain connectivity dynamics in the resting state”, Cereb Cortex, Nov 2012.
Resting state data from E. Allen, et al, “A baseline for the multivariate comparison of resting state networks,” Frontiers in Systems Neuroscience, vol. 5, p. 12, 2011.
T-maps of 28 resting state networks. See Network Labels
T-maps of all 100 components See Component Labels
Composite T maps of 7 groups resampled to 1mm^3 space and their labels.
Mean ICA components from Stevens, V. D. Calhoun, G. D. Pearlson, and K. A. Kiehl, “Brain network dynamics during error commission,” Hum.Brain Map., vol. 30, pp. 24-37, 2009